Ag Dealers Say These Marketing Services Have the Best ROI
A recent survey released by Farm Equipment Magazine is being described as the first of its kind and it highlights one of our favorite topics – Dealer Marketing! The goal of this survey was to help farm equipment dealers in the United States benchmark how they’re allocating their marketing dollars compared to other industries at large to ultimately see whether they’re aligned. The results of the survey were announced to the attendees of Farm Equipment’s 2018 Dealership Minds Summit.
Survey Background
To provide more background on the survey, it was an 18 question survey sent out via fax and/or email to the top farm equipment executives and marketing managers this past June. By early July, Farm Equipment had garnered responses from 160 equipment dealers. These dealers accounted for about $10.7 billion in 2017’s sales revenue and operate a total of 950 individual stores. The group averaged 6 stores and 2 marketing personnel per dealer, as well as 17 employees per store.
For the dealers that provided information on their total annual agriculture marketing expenditure budgets, a little less than $302,500 on average is being spent in 2018. When breaking these budgets down further, dealers are spending nearly $52,000 per store this year.
When looking at these dealers’ revenue, their responses showed that roughly 64% of revenue came from production agriculture customers, 25% of revenue came from rural lifestyle customers and 11% came from lawn, turf and landscape customers.
The survey also made sure to ask respondents whether their marketing initiatives were centralized at the company’s headquarters office, or managed at the individual store level. A little over three quarters of dealers said they have a centralized marketing structure.
Dealer Product Focus
There were several areas dealers wanted to focus their marketing efforts as indicated by the survey. New and used equipment sales were the objectives that earned the highest percentage, averaging 71.2% of total marketing objectives when combined. Following that was parts sales and service and repairs sales, making up 17.4% of marketing objectives on average. Dealership branding, averaged out to be 5.6% of of survey respondents’ marketing initiatives.
Their objectives and overall spend did have a noticeable difference based on the dealership size. The single store dealerships put the highest chunk of their marketing budgets toward NEW equipment sales on average. As for dealers with 2-4 stores, they claimed the highest average percentage goes toward USED equipment sales, which brings us to their budget based on their revenue.
Budget Based on Revenue
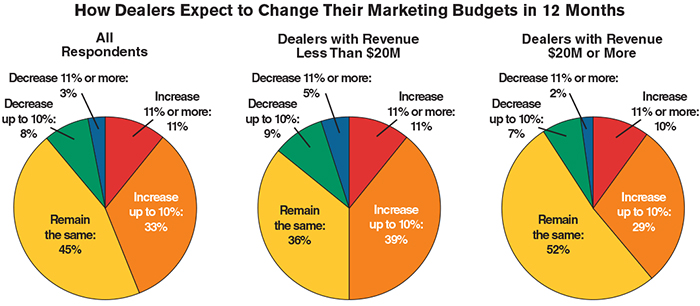
Another interesting result of the survey was how a dealer’s larger budget impacted the adjustments to the upcoming year’s marketing budget. For example, the larger the dealership (with regards to revenue), the less likely the dealership is to plan on making changes to its marketing budget.
As for dealers who brought in less than $20 million in revenue last year, only 36% said they’ll keep their marketing budget the same next year, while 39% said they expect to increase their budget by up to 10%. Additionally, a higher percentage of dealers in the less-than $20 million range say they plan to DECREASE their marketing budgets relative to those who brought in $20 million or more.
Overall, nearly one-tenth of dealers making less than $20 million plan to DECREASE their marketing budgets, while 7% of dealers making $20 million or more said they planned to do the same thing next year.
Here’s a great chart, courtesy of Farm Equipment, that better maps this out:
Marketing Priorities & ROI
Arguably one of the most interesting findings from the survey, for marketers in particular, was how dealers prioritized the different kind of marketing tactics. Their priorities were as follows:
- Attracting more contacts & leads
- Converting contacts and leads to buyers
- Supporting, retaining and increasing spending with current customers
- Dealership branding
- Product brand awareness
- Tracking and proving ROI for marketing investments
- Reducing cost/contacts
When it came to the marketing strategies that dealers believed yielded the best returns for these priorities, they were as follows:
- Website advertising
- Data Services
- Website design, development and maintenance
- Radio/TV Advertising
- Print Advertising
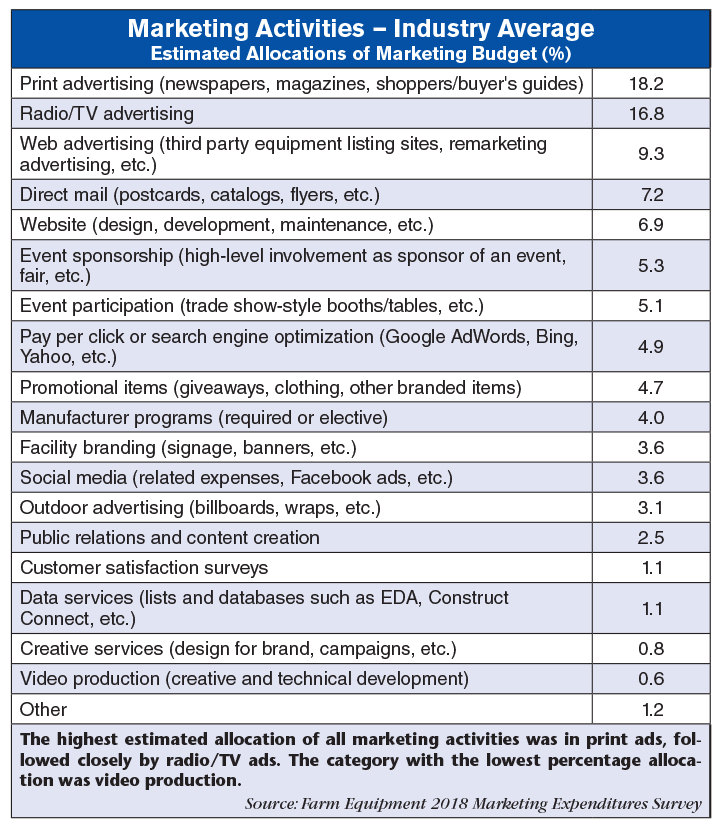
However, radio and/or TV advertising takes up average of 16.8% of budgets and print advertising commands 18.2% of budgets. Compared to website advertising, which was 9.3% and 1.1% for Data Services. This means that dealers see the worth of digital marketing, but aren’t investing enough in these types of channels. Here’s a deeper look at what percentages were allocated to which strategies:
Impact of Store & Employee Numbers
The size of the dealership seemed to also have an impact on where marketing dollars were spent. For example, smaller dealers leaned towards traditional advertising, whereas a single store dealership allocated the highest percentage of marketing dollars toward radio, TV and print ads. They also allocated the most to website design, development and maintenance, though not by a large margin.
Dealers with two to four stores allocated the most to Pay-Per-Click or Search Engine Optimization initiatives, while dealers with five to nine stores invested the most in social media. Dealers with 10+ stores contributed the most to data services and video production.
As for the number of employees, radio/TV advertising and print percentages seemed to decrease as the number of employees increased. Dealers with 1-20 employees allocate 22.6% of marketing initiatives to radio and TV ads and 18.6% to print advertising. Dealers with 41-60 employees drop to 13.9% and 13%.
Popular Months
On average, the month rated the most important for marketing specifically was March. After March, May was rated the most important followed by April. With little surprise, January was rated the least important.
The Spring months had an average ranking of 23.1, the highest of all the seasons. Following that is Fall, with an average ranking of 19.5. Summer was next with a combined rank of 18.3, and in lastly Winter, with a combined score of 17.0.
Dealers’ revenue also played a role in which month was rated more important. For example, in 2017, dealers with $150M+ in revenue rated May the most important month.
Takeaways
Our top takeaways from the survey focused around the highest rated marketing priorities for ROI, how the size of the dealership impacted marketing budget and techniques, as well as popular seasons. These were critical for us to better understand the needs of our dealers and show them what their peers and ultimately competitors are investing in.
So if we had to narrow it down to 3 takeaways, they’d be:
- Dealers see the most ROI from digital marketing, but are spending the most budget on traditional like radio, TV and print advertising potentially doing them a great disservice.
- Smaller dealers are focused on more traditional marketing techniques, whereas larger dealers are more modern in their approach to marketing.
- Not to our surprise, the Spring season was most popular for dealers no matter what size.